How do I use the Portfolio?
The Portfolio, located in the "Overview" section of the sidebar, is a handy automatically-generated report that you can use to analyze the market value of your investments. It includes one table that summarizes the overall performance of your current holdings and another table that details individual securities with subtotals by account, type, or risk. Select "Portfolio" in the sidebar to view this report to the right:
By default, the figures shown on the report are for the current date, but you can use the forward and back buttons at the top right of the report to change the date. Most figures are calculated using Banktivity's current security prices: click the "Update" button  on the toolbar to download the latest quotes.
If you use multiple currencies, the Portfolio automatically converts all totals to the document's display currency using Banktivity's current exchange rates. Click the "Update" button on the toolbar to download the latest rates. To set the display currency, click "Configuration" in the sidebar, click "Currencies," and use the popup menu button at the top right of the currency list to choose a currency.
Interpret the Portfolio report
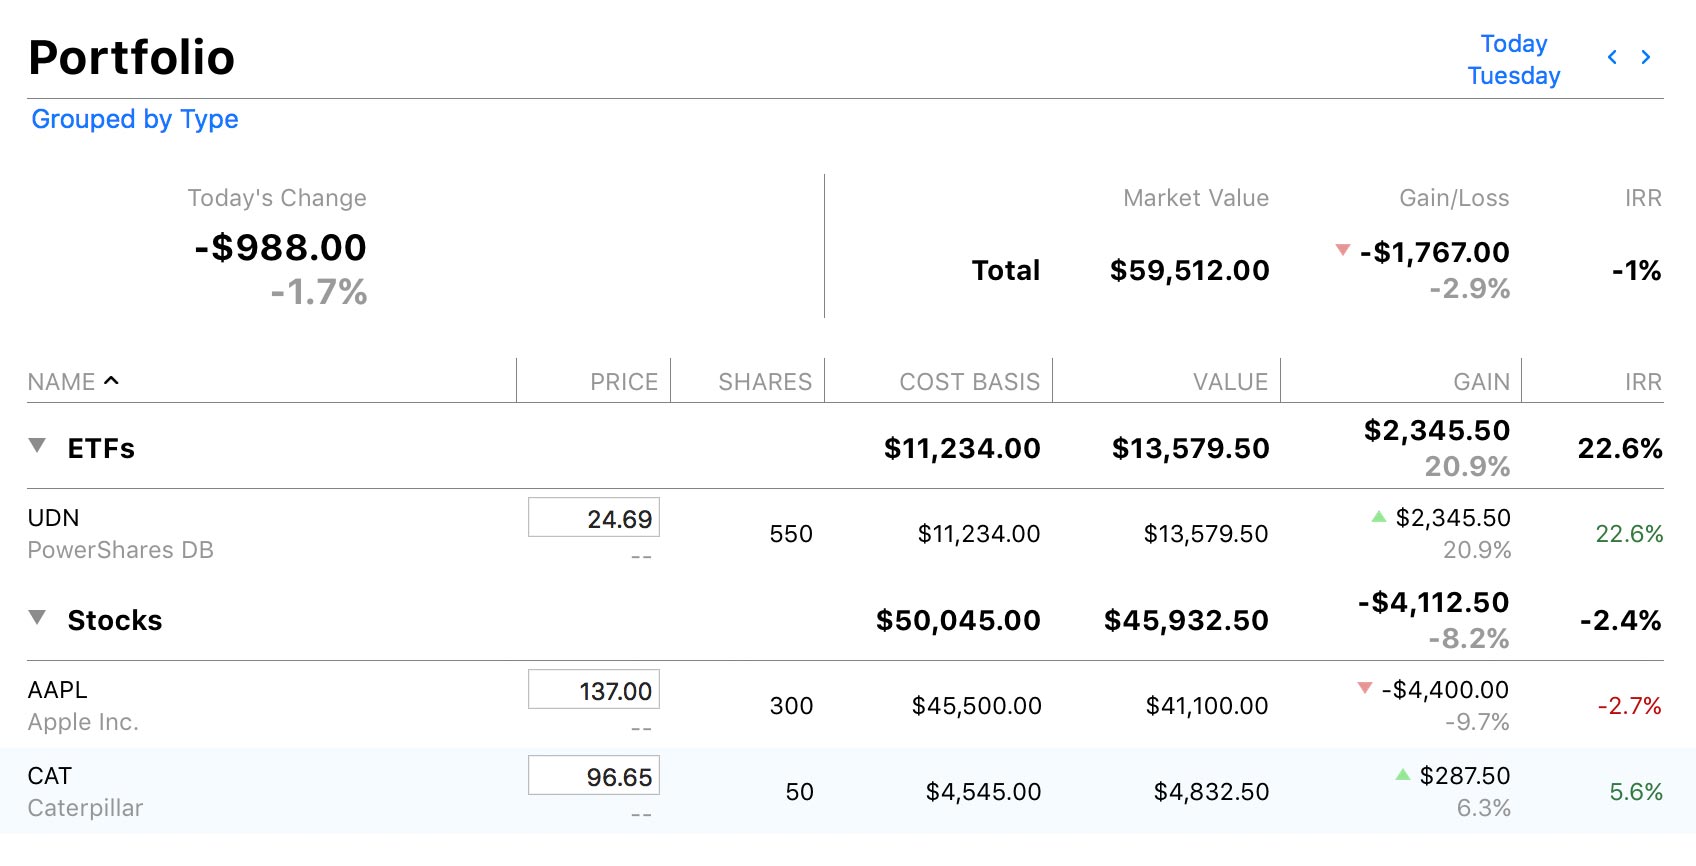
Summary table
At the top left of the report is the total change in value for all the securities you currently hold, expressed both as an amount and as a percentage, since the close of business on the previous day. To the right is the total estimated market value of your holdings, the total unrealized gain or loss relative to your cost basis (expressed both as an amount and as a percentage), and the internal rate of return (a measure of the profitability of your investments).
Detail table
Below the summary table is a list of each security you currently hold, grouped by account, type, or risk. To change the grouping, click "Grouped by" at the top of the report and choose the option you prefer.
Based on your selection, you will see one row for each group, along with its total cost basis, market value, gain/loss, and internal rate of return. Click the disclosure triangle next to the group name to show each of the securities you currently hold in that group. Option-click the triangle to expand all the groups at once.
Each security shows its name and symbol followed by its current price, change in value since the close of business on the previous day, number of shares currently held, cost basis (amount paid for the shares), estimated market value, unrealized gain or loss relative to the cost basis (expressed both as an amount and as a percentage), and internal rate of return. You can change the security price directly by selecting it and typing in a new amount; the change will also be recorded in the security's price history chart.
You can sort the securities within each group by clicking the heading of the column you want to sort by. Click the same heading again to reverse the sorting direction.
Interpret the Security Detail report
Click any security in the portfolio report to drill down to the security detail report for that item:
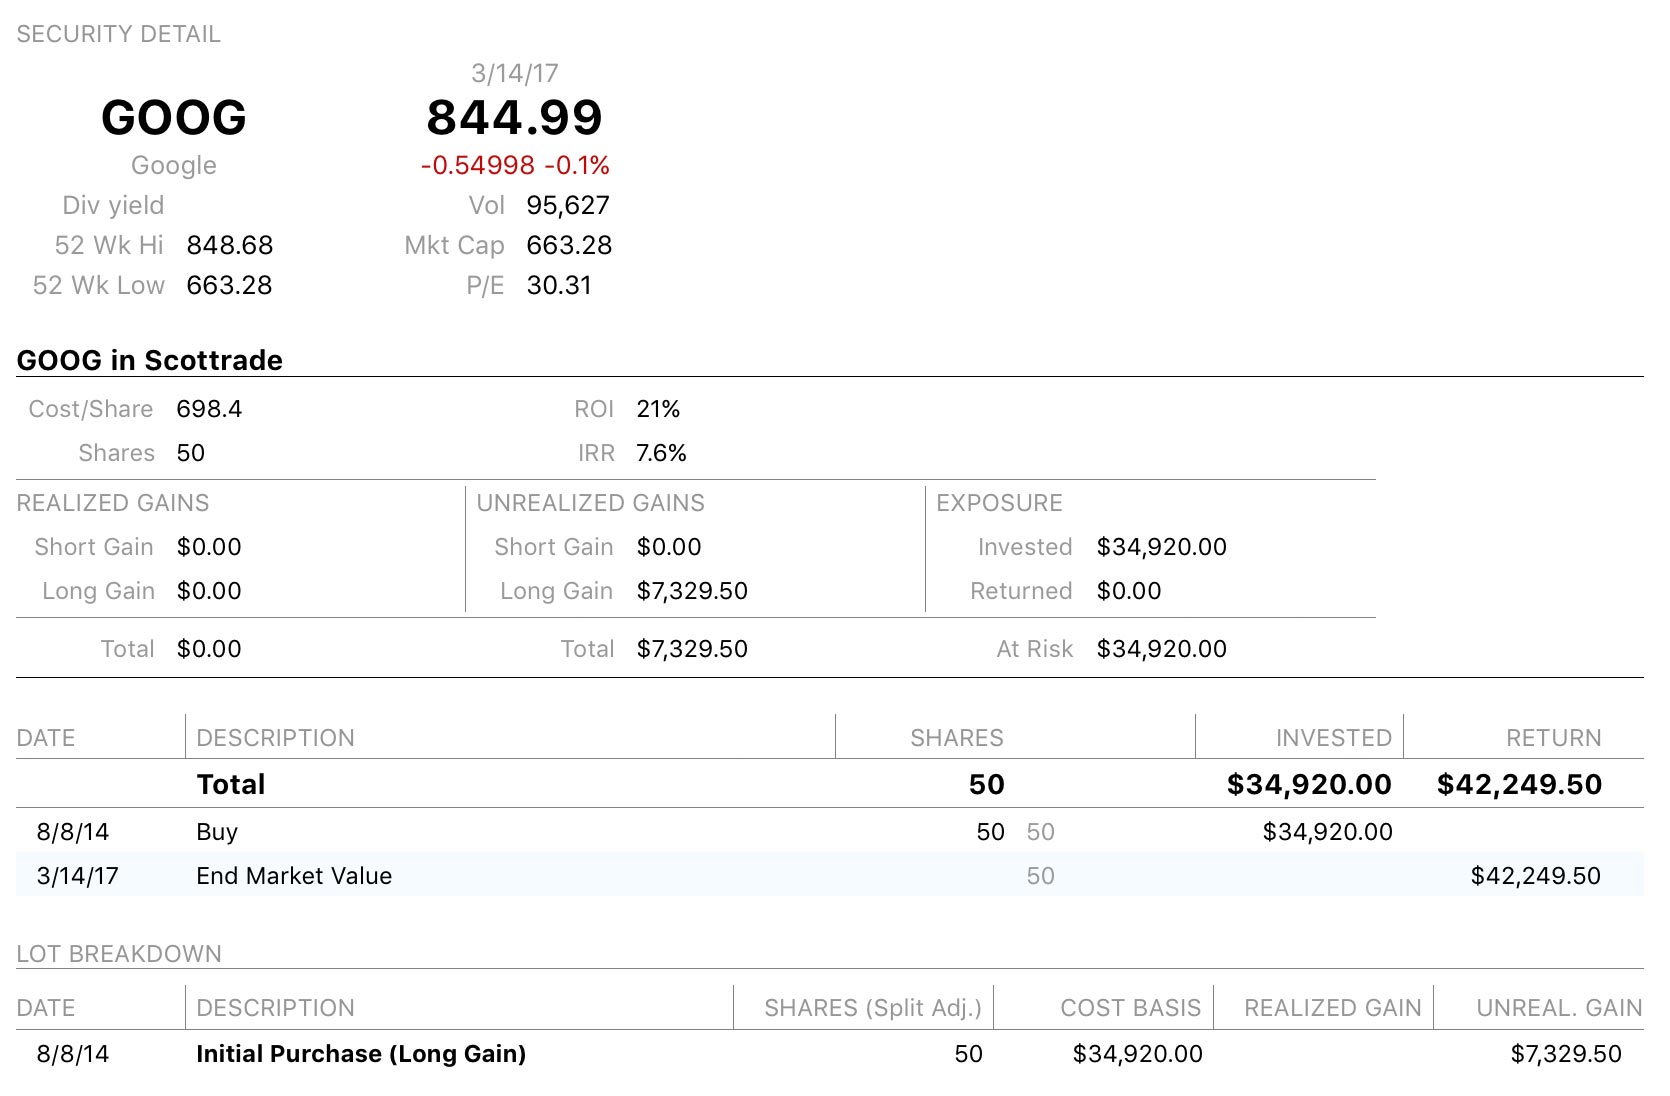
This is a report that shows detailed information about a specific security. At the top is a table with current market data for the security. Below that are three tables for each account in which you hold shares of the security: one shows performance metrics for the shares you hold, another lists transactions pertaining to the security, and a third shows the details of each share lot.
By default, the metrics on this report are calculated using the entire transaction history of the shares in the account. You can adjust the timeframe by clicking the "Edit" button in the navigation bar. See About Reports for more information about editing reports.
Market data
At the top of the report is a table showing the security's name, symbol, current price per share, change in value since the close of business on the previous day (expressed both as a number and as a percentage), dividend yield, 52-week high and low prices, trade volume, market capitalization, and price-to-earnings ratio. All of these figures are relative to the date of the report indicated above the share price.
To make sure Banktivity has the latest market data, click the "Update" button on the toolbar. If the date shown at the top of the report is not current, make sure the report is configured to "Report across entire date range." Also keep in mind that markets are closed on weekends, so the date may reflect the most recent business day.
Performance metrics
This table shows several figures that help you to analyze the performance of the shares you hold in a particular account. At the top is the cost per share, the number of shares held, return on investment (ROI), and internal rate of return (IRR).
ROI combines information about your realized gains, unrealized gains, and other security income into a single metric that can be used to compare the overall performance of your investments at a point in time. IRR is an annualized rate equal to the interest rate on a bank account that would give you the same total return on your investment. Whereas ROI is useful for seeing a snapshot of your returns during a fixed period of time, IRR is useful for extrapolating your returns to other timeframes.
Below that is a table of realized gains (profit or loss from shares sold), unrealized gains (potential profit or loss from the sale of current holdings), and exposure (the value of current holdings at risk should the market fall). Each set of capital gains is broken down into short and long term. Capital gains are considered long term when they result from a sale of shares that were held for more than one year. Exposure details the total amount invested (the total cost of all share purchases), returned (the total income from all share sales), and the amount currently at risk (the difference between the previous two).
Lot breakdown
This table details your security lots. Each position that you opened is listed in bold text with its date of purchase, number of shares (adjusted for splits), and cost basis. Each sale pertaining to the lot is listed in plain text underneath, with its date, number of shares, and realized gain. Remaining shares in each lot are shown with the number of shares left, the cost basis pertaining to those shares, and the current value of unrealized gains. In the description column, short and long term gains are indicated where appropriate.
Print, save, and export report data
Information displayed in the Portfolio can be printed, saved, and exported just like any other report. For more information about using these features, see About Reports.