How do I use the Investment Summary report?
The Investment Summary report type is used to analyze the performance of your investments. It includes charts and tables to help you review your investment account values, the diversity of your portfolio (by security type and risk), your capital gains (realized and unrealized), and the return on your investment (ROI).
Interpret the Investment Summary report
The report's name and type are shown at the top left of the report, along with the number of investment accounts included in the report (or the name of the account if there is only one). Unless the report is configured to use all dates, the date range used for the report is at the top right. Click the arrow buttons to the left or right of the date to move backward or forward in time. Comparison periods are not available for this report.
Account summary table
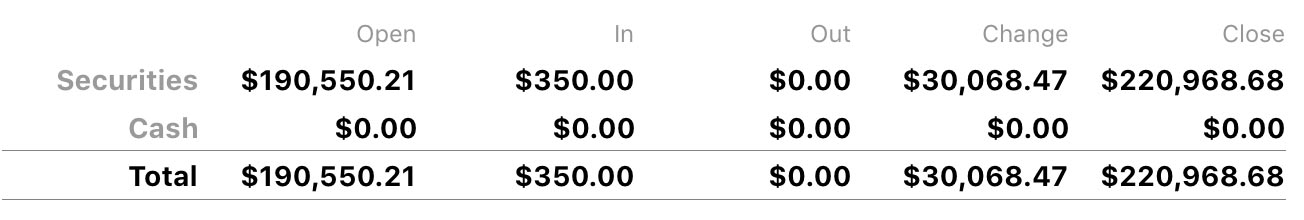
At the top of the report is a table summarizing the changes to your investment account balances over the date range covered by the report. Values are broken out into securities and cash with totals at the bottom.
- Open (Securities): The market value of securities held in your investment accounts on the start date of the report.
- Open (Cash): The amount of unallocated cash in your investment accounts on the start date of the report.
- In (Securities): The amount paid for securities purchased within the report period.
- In (Cash): The amount of cash deposited into your investment accounts within the report period.
- Out (Securities): The amount earned from securities sold within the report period.
- Out (Cash): The amount of cash withdrawn from your investment accounts within the report period.
- Change (Securities): The change in the value of your securities during the report period, equal to the closing value and securities out minus the opening value and securities in.
- Change (Cash): The difference between cash in and cash out during the report period.
- Close (Securities): The market value of securities held in your investment accounts on the end date of the report.
- Close (Cash): The total amount of unallocated cash in your investment accounts on the end date of the report.
Account timeline bar chart
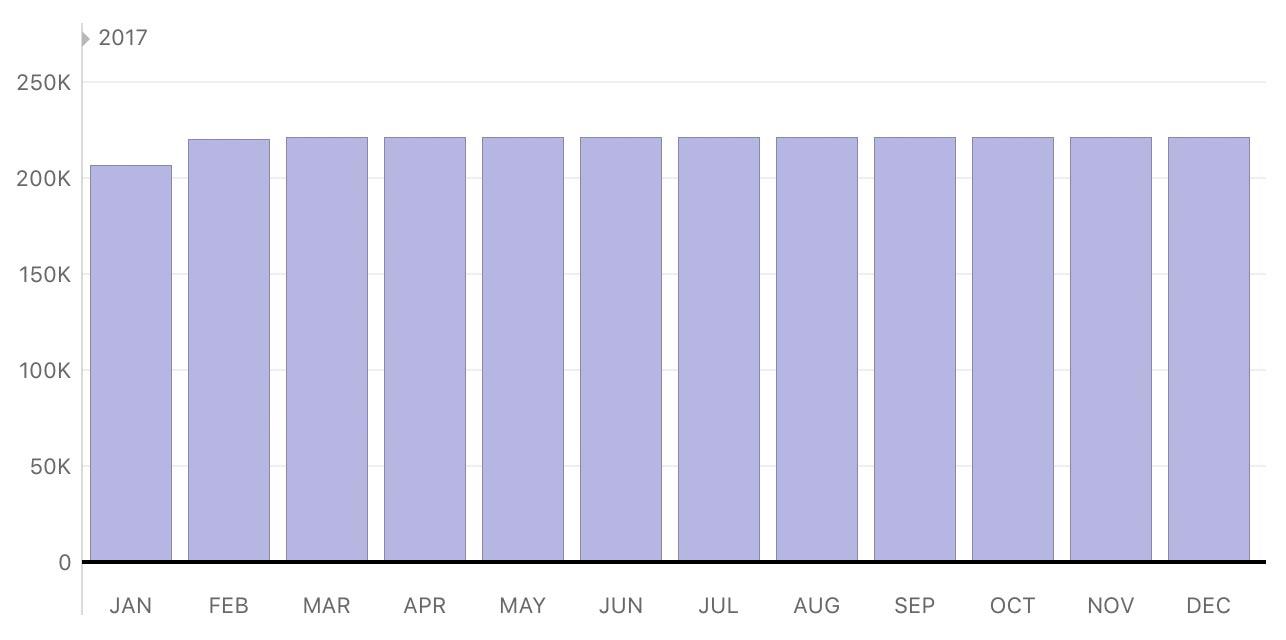
Below the table is a bar chart depicting the value of your investment accounts over time. Each bar represents the total value of your accounts at the end of a period within the report's full date range. Assets are drawn above the horizontal axis and consist of cash (unallocated money in your investment accounts, in purple) and securities (market value of shares you hold, in green). Liabilities are drawn below the axis and consist of cash (money overdrawn from investment accounts, in dark pink) and securities (market value of short sales, in light pink). The gray line indicates the total value of your investment accounts at each interval.
Hover the mouse over a bar to view the value of security assets, cash assets, security liabilities, and cash liabilities at the end of the corresponding period. Click on a bar to view an Investment Summary report restricted to that date range.
Value by type and risk bar charts
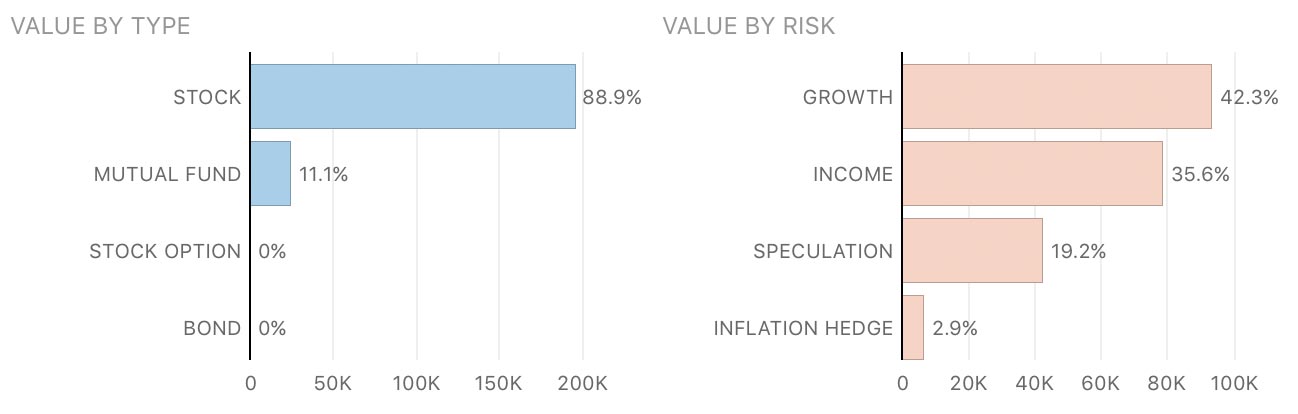
These are bar charts depicting the security shares you currently hold (as of the end date of the report). The chart on the left shows a breakdown of the shares by security type; the chart on the right shows a breakdown by risk level. Each bar represents the total market value of the shares of a particular type or risk, and the bars are drawn proportionally so that you can see which shares are worth more. Unallocated cash in your investment accounts is also included for comparison.
Hover the mouse over a bar to view the type or risk classification, market value of the shares, and percentage relative to the other classifications. Click on any bar in the chart to view an Investment Summary report restricted to the corresponding securities.
Capital gains table
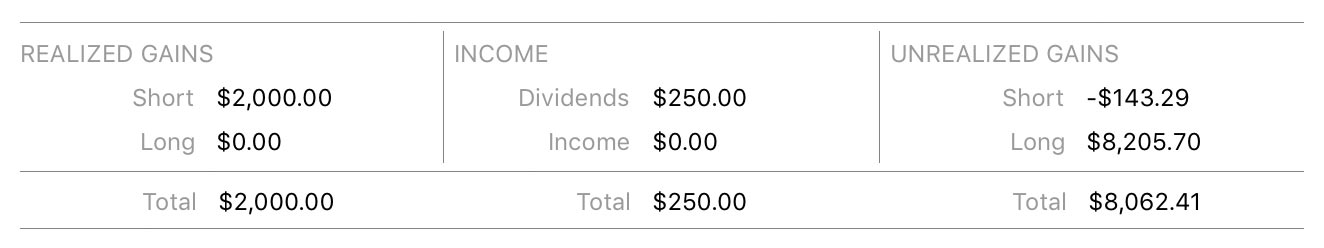
This is a table detailing real and potential income from your investments.
- Realized gains: Profit or loss from investments you sold within the report's date range. Broken down into short and long term based on whether the shares were held for less than or more than a year, respectively.
- Income: Earnings from dividends, interest income, investment income, capital gains distributions, and returns of capital. Broken down into dividends and all other income types.
- Unrealized gains: Potential profit or loss from investments you currently hold (based on their market value on the report's end date). Broken down into short and long term based on whether the shares were held for less than or more than a year, respectively.
Click on "Realized Gains" or "Income" to drill down and view a Capital Gains report for those items (see below). Click on "Unrealized Gains" to view the Portfolio.
Securities table
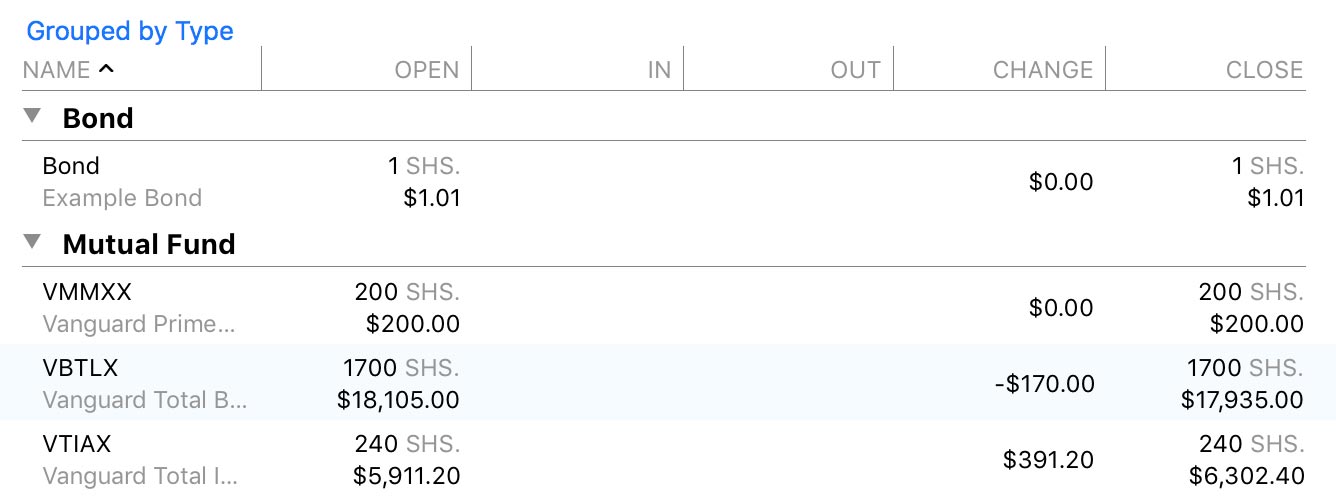
This is a table detailing changes in the value of your investments over the date range covered by the report. By default, securities are grouped by account, but you can group them by risk or type by clicking "Grouped by Account" and changing the selection. Each security shows the following details:
- Name: The symbol and name of the security.
- Open: The number of shares held in the account and their market value on the report's start date.
- In: The number and value of shares purchased or otherwise acquired during the report period.
- Out: The number and value of shares sold or otherwise moved out of the account during the report period.
- Change: The change in the value of the security during the report period, equal to the closing value and shares out minus the opening value and shares in.
- Close: The number of shares held in the account and their market value on the report's end date.
- ROI/IRR: Return on investment (ROI) combines information about your realized gains, unrealized gains, and other security income into a single metric that can be used to compare the overall performance of your investments at a point in time. Internal rate of return (IRR) is an annualized rate equal to the interest rate on a bank account that would give you the same total return on your investment. Whereas ROI is useful for seeing a snapshot of your returns during a fixed period of time, IRR is useful for extrapolating your returns to other timeframes.
If the internal rate of return exceeds 1000%, Banktivity does not report it. Although it may indicate extremely rapid growth or loss within a very short time frame, such a high rate is much more likely to be the result of an error in the transaction records.
Click on any security to drill down and view a Security Detail report for that item (see Portfolio).
Interpret the Capital Gains report
This report details real income earned in your investment accounts. Broken down first by account and then by security, it provides several details for analyzing the performance of your investments.
The report's name and type are shown at the top left of the report. Unless the report is configured to use all dates, the date range used for the report is at the top right. Click the arrow buttons to the left or right of the date to move backward or forward in time. Comparison periods are not available for this report.
Account summary table
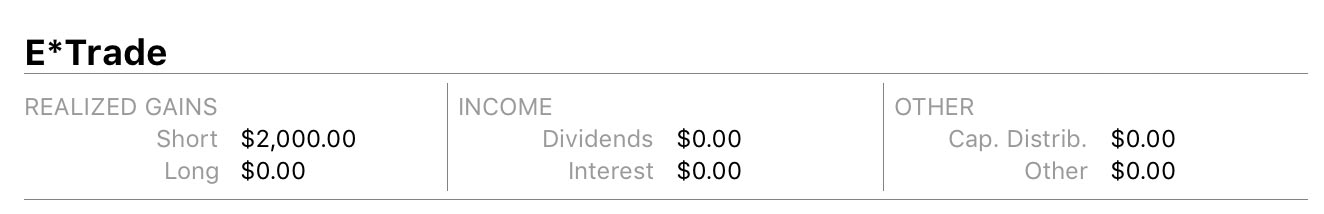
This is a table summarizing real income from all investments in an account:
- Realized gains: Profit or loss from investments you sold within the report's date range. Broken down into short and long term based on whether the shares were held for less than or more than a year, respectively.
- Income: Earnings from dividends, interest income, and investment income.
- Other: Earnings from capital gains distributions and returns of capital.
Security capital gains table
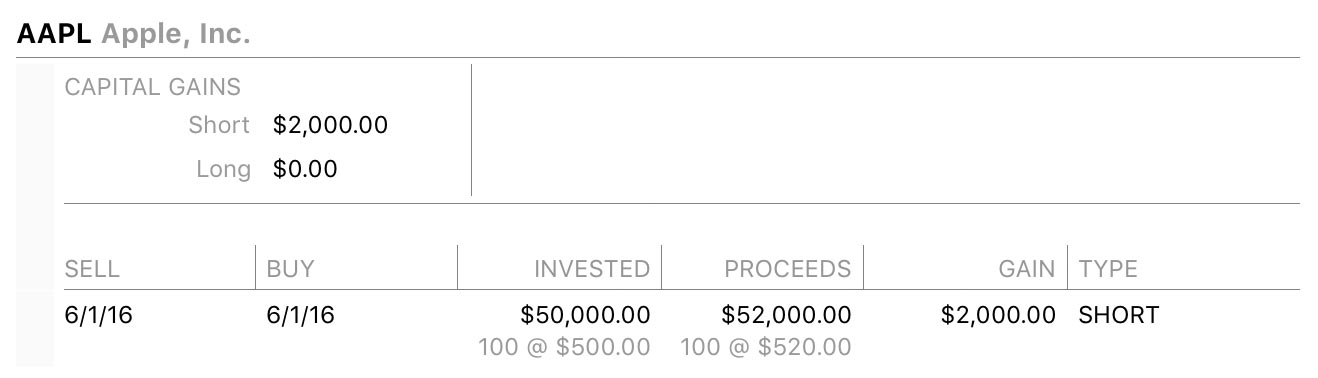
At the top of this table are the values of realized capital gains, both short and long term, for a specific security. Below that is a detailed list of sales by lot that contribute to the total gains. Each item shows the date on which shares were sold, the date on which they were originally acquired, the cost basis for the shares, the proceeds from the sale, the net gain or loss, and whether it is counted as short or long term.
Click any sale in this list to drill down and view the corresponding transaction in its account register. Any changes you make to the transaction will be reflected on the report immediately after saving.
Security income table
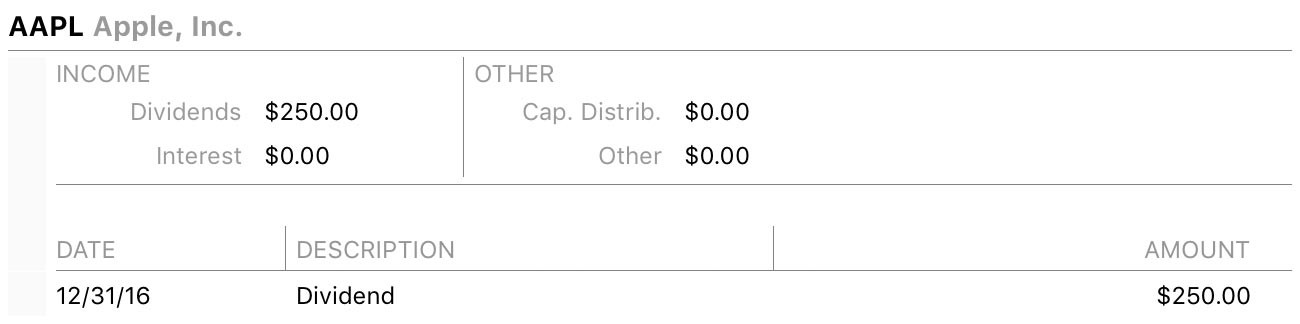
At the top of this table are the income totals from dividends, interest income and investment income, capital distributions, and returns of capital for a specific security. Below that is a detailed list of transactions that contribute to the total income. Each transaction shows its date, type, and amount. Click any transaction in this list to drill down and view it in its account register. Any changes you make to the transaction will be reflected on the report immediately after saving.
Learn more about reports
For more information about configuring report options, see Add a Report. For more information about printing, exporting, and otherwise managing reports, see About Reports.