How do I read a budget?
Once you have finished configuring a budget, Banktivity automatically reads the transactions from your accounts, compares your income and expenses against your expectations, and presents the results in an easy-to-read format.
Reading budgets on iPad and iPhone is slightly different from the MacOS version of Banktivity. If you want to jump to iOS specific information on this page, Click Here, Otherwise you can continue on from here.
Change the budget time period
At the top right corner of the budget view, below the main toolbar, you will find the budget period controls:

The popup menu button indicates the current budget interval and time period. By default, the budget shows whatever time period includes the current date. Click the button to change the interval to a week, month, quarter, or year. To move backward and forward in time, click the left and right arrows, respectively. The information shown on the budget will update accordingly so that you can see what you budgeted and how you performed during any time period.
Any changes you make to your budget configuration in one period will apply to that period and into the future. Banktivity tracks each of the changes you make so that when you view a past budget period it will remember how your budget was configured at that point in time.
Interpret the Budget progress chart
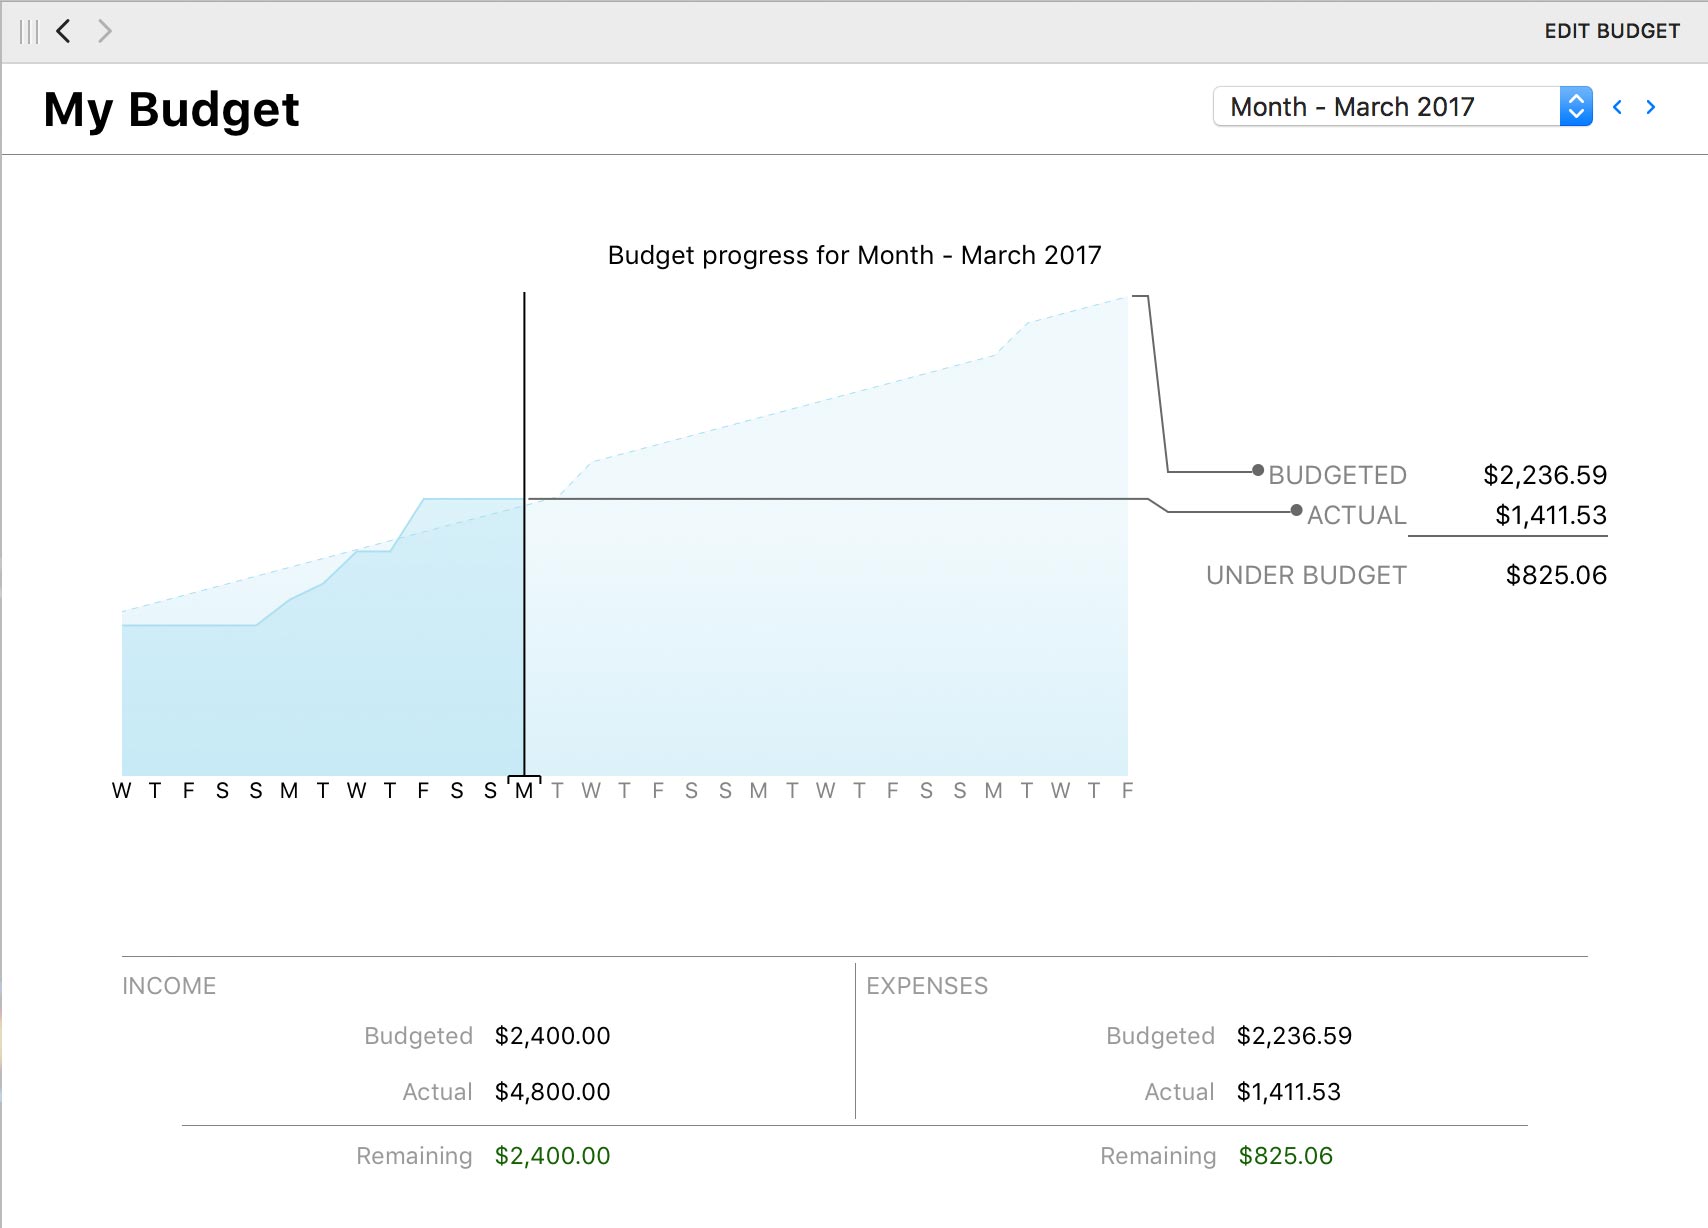
This chart shows a line plot of your budgeted and actual expenses during the time period you are viewing. The dashed line represents your budgeted expenses, while the solid line represents your actual spending. Totals for each are displayed to the right, along with the difference between them. This difference is your total expense surplus or deficit for the budget period. If the current date falls within the time period you are viewing, a vertical line will appear on the chart to indicate today.
Interpret the summary table
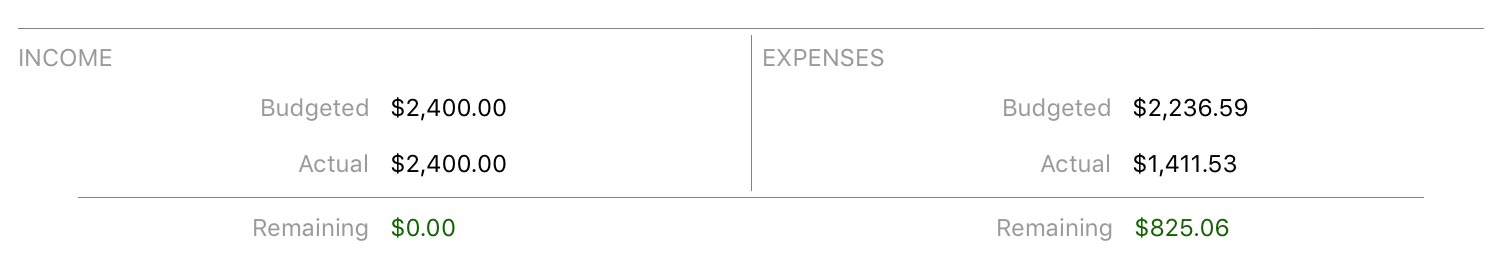
Below the line chart is a table summarizing your budget performance for the time period you are viewing. It has two columns, one showing income and the other showing expenses. In each column, the amount you budgeted is shown along with the actual amount you earned or spent and the difference between those amounts. Differences in red indicate a deficit; those in green indicate a surplus. If you use multiple currencies, all the amounts in this table are automatically converted to the budget's currency using the latest exchange rates.
Interpret the expenses & income table
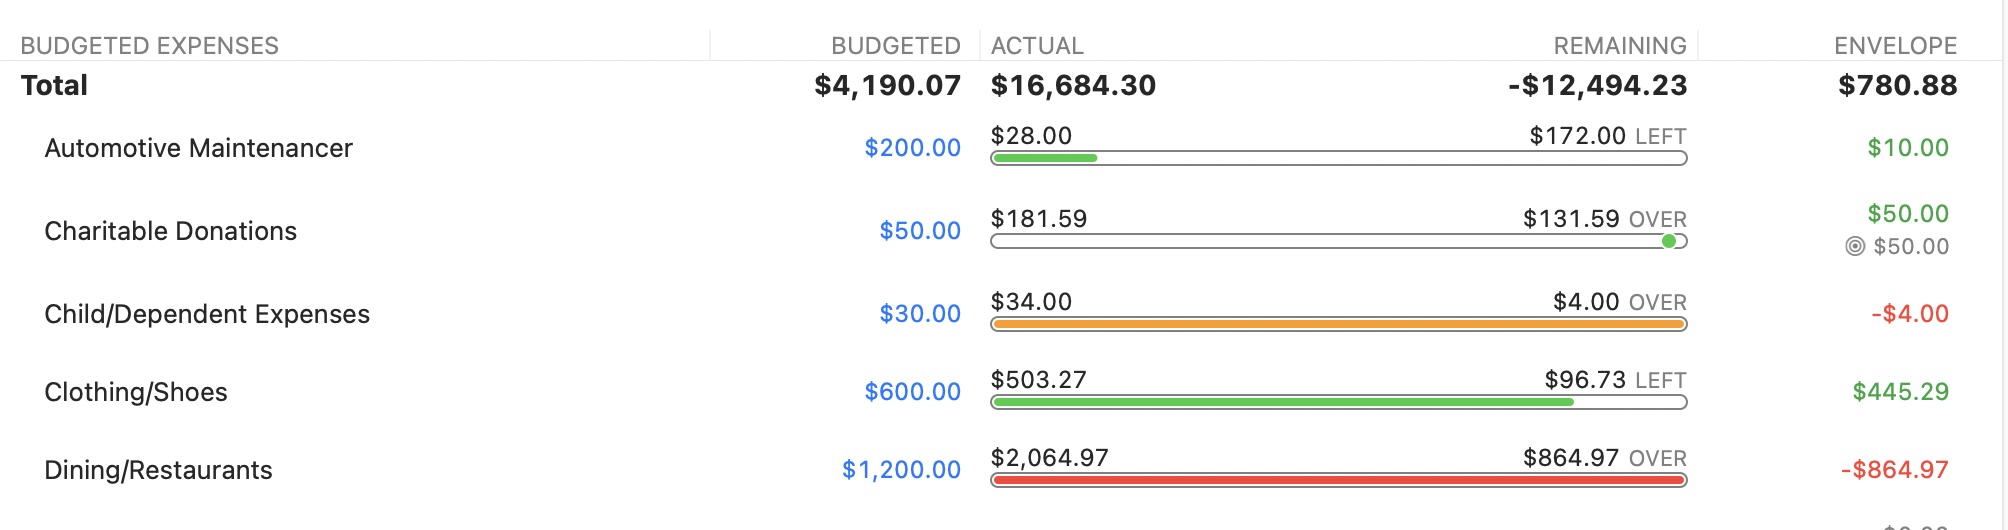
Below the summary information is a table detailing your expenses and income during the budget period. It includes the following columns:
- Expenses/Income: The name of the category (or account, in the case of a budgeted transfer).
- Progress: A colored progress bar that
illustrates the percentage of actual vs. budgeted spending or
earning in the category during the time period you are viewing.
For expenses, green indicates that you are below
or at your expected spending, yellow and orange indicate that you
are slightly over what you expected, and red indicates that you
spent much more than you expected. Performance is relative to
the current date, so that you can tell whether your
earning and spending are on track throughout the budget
period.
Scheduled income and expenses appear as circles placed on the bar according to their due dates. Empty circles have not been paid yet. For income, red circles indicate underpayment and green circles indicate on-target or overpayment. For expenses, green circles indicate underpayment or on-target and red circles indicate overpayment. A triangle indicator under this column indicates today's date. - Budgeted: The amount you expected to spend or earn in the category during the budget period, including scheduled and unscheduled items.
- Actual: The amount you actually earned or spent in the category during the budget period. If you use multiple currencies, this amount is automatically converted to the budget's default currency using the latest exchange rates.
- Remaining: This amount shows the difference between the budgeted amount and the actual amount in the selected timeframe.
- Envelope: The amount of cash currently saved for the category (only appears when envelope budgeting is enabled).
The category rows that follow are grouped into four sections: Budgeted Expenses, Budgeted Income, Unbudgeted Expenses, and Unbudgeted Income. The Budgeted sections show the categories you planned to include in your budget; the Unexpected sections show income and expenses you did not plan for, including uncategorized transactions. These can be useful for refining your budget and making sure it includes all of your actual spending. Categories with sub-categories show disclosure triangle buttons to the left of their names. Click one of these to reveal the sub-categories within a category, or Option-click to reveal all sub-categories.
Click on any category or sub-category to "drill down" and view more detailed information about it. The next screen shows the budgeted and actual totals for that category (and its sub-categories), any scheduled income or expenses set up in your budget for that category, and a list of transactions that make up the total shown for that category. Click a scheduled budget item to view and edit it in the main scheduled transactions list. Click a transaction to view and edit it in its account register. Any changes you make to transactions will cause the budget to be updated automatically. Use the arrow buttons at the top left corner of the current workspace to navigate back and forth as you drill down into the report details.
Budget display currency
The budget uses the currency that was chosen during creation. This cannot be changed afterwards. If you choose to change your default document currency, this will not change the way the budget displays or the way that amounts are entered.
Print or save a copy of the budget
The main report and any of the detailed reports that you can drill down to can be printed simply by choosing File > Print and clicking the "Print" button. The paper size used for the printout can be changed by choosing File > Page Setup and selecting a different setting, but the orientation is restricted to portrait mode (landscape is not permitted).
To save a copy of a report as a PDF file, choose File > Print, then click the "PDF" button and choose "Save As PDF." Enter a name for the new file, choose where you want to save it, and click "Save." You will then have a copy of the report that you can view and print using the Preview application or any standard PDF reader.
How do I read a budget on iPad or iPhone?
At the top of the budget you will see a graph that will show individual months in the past as well as a toggle for "YTD" and "Current". You can switch between year to date and the current month using that toggle or you can use the slider on the graph to select multiple months to include in the scope of the budget:
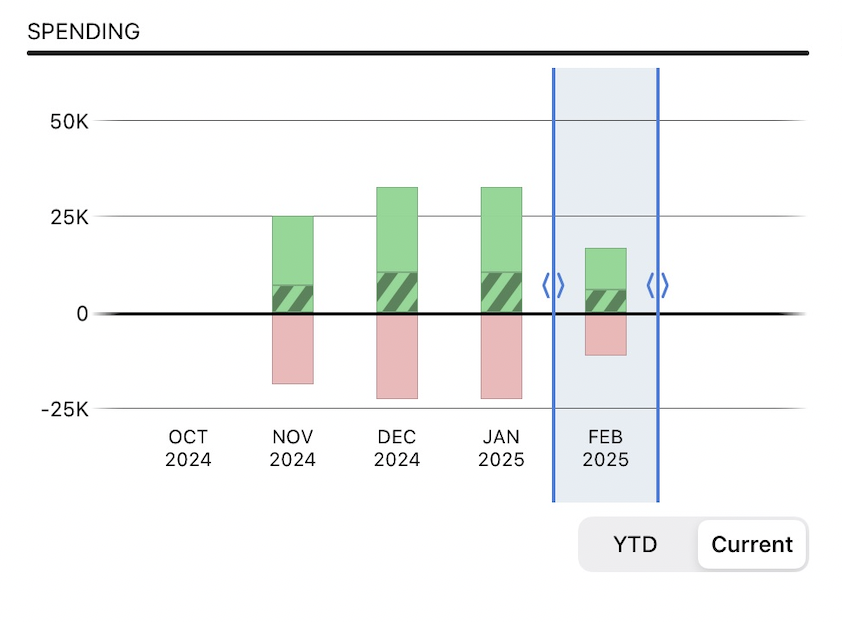
Interpret the Budget Spending graph from the document summary:
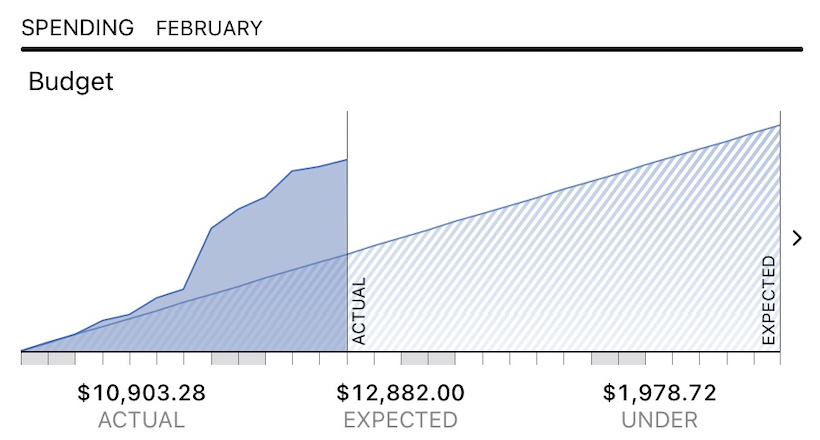
This chart shows a line plot of your budgeted and actual expenses during the current month. The striped area represents your expected expenses, while the solid area represents your actual spending. Totals for each are displayed below the graph, along with the remaining expected amount shown as "UNDER". This UNDER amount is your total expense surplus or deficit for the current month. A vertical line will appear on the chart to indicate today.
Interpret the summary table
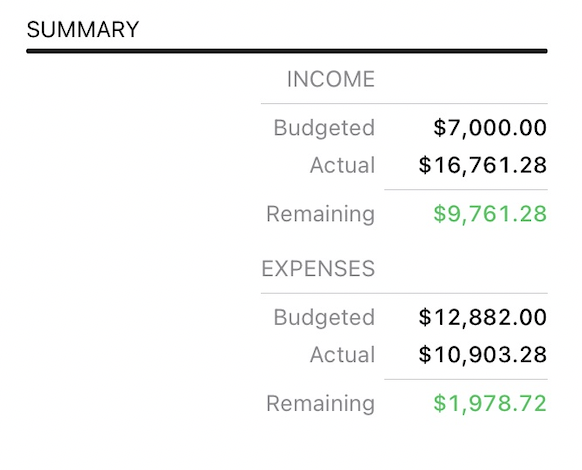
This is a table summarizing your budget performance for the time period you are viewing. It has two sections, one showing income and the other showing expenses. In each section, the amount you budgeted is shown along with the actual amount you earned or spent and the remaining amount between those amounts. Differences in red indicate a deficit; those in green indicate a surplus. If you use multiple currencies, all the amounts in this table are automatically converted to the document's default currency using the latest exchange rates.
Interpret the expense & income table
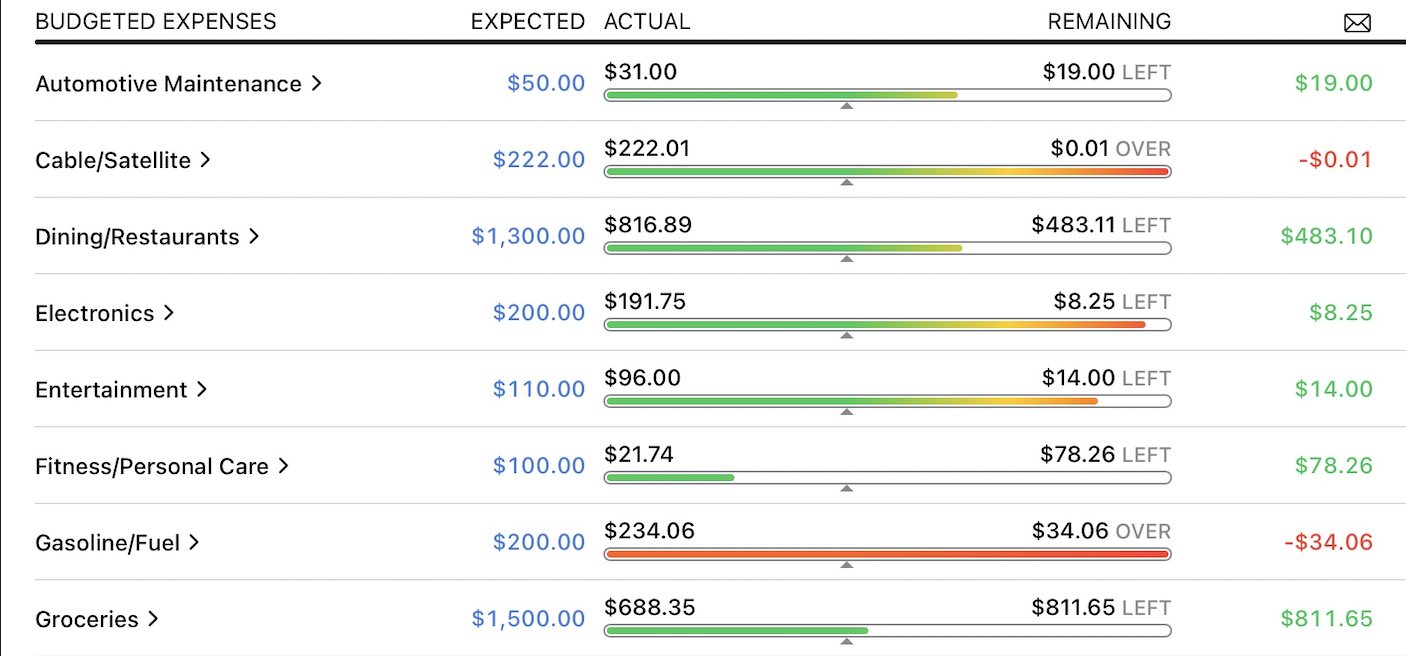
Below the summary information is a table detailing your expenses and income during the budget period. It includes the following columns:
- Expenses/Income: The name of the category (or account, in the case of a budgeted transfer).
- Progress: A colored progress bar that
illustrates the percentage of actual vs. budgeted spending or
earning in the category during the time period you are viewing.
For expenses, green indicates that you are below
or at your expected spending, yellow and orange indicate that you
are slightly over what you expected, and red indicates that you
spent much more than you expected. Performance is relative to
the current date, so that you can tell whether your
earning and spending are on track throughout the budget
period.
Scheduled income and expenses appear as circles placed on the bar according to their due dates. Empty circles have not been paid yet. For income, red circles indicate underpayment and green circles indicate on-target or overpayment. For expenses, green circles indicate underpayment or on-target and red circles indicate overpayment. A triangle indicator under this column indicates today's date. - Budgeted: The amount you expected to spend or earn in the category during the budget period, including scheduled and unscheduled items.
- Actual: The amount you actually earned or spent in the category during the budget period. If you use multiple currencies, this amount is automatically converted to the budget's default currency using the latest exchange rates.
- Remaining: This amount shows the difference between the budgeted amount and the actual amount in the selected timeframe.
- Envelope: The amount of cash currently saved for the category (only appears when envelope budgeting is enabled).
The category rows that follow are grouped into four sections: Budgeted Expenses, Budgeted Income, Unbudgeted Expenses, and Unbudgeted Income. The Budgeted sections show the categories you planned to include in your budget; the Unbudgeted sections show income and expenses you did not plan for, including uncategorized transactions. These can be useful for refining your budget and making sure it includes all of your actual spending. Categories with sub-categories show disclosure triangle buttons to the left of their names. Tap one of these to reveal the sub-categories within a category.
Tap on any category or sub-category to "drill down" and view more detailed information about it. The next screen shows the budgeted and actual totals for that category (and its sub-categories), any scheduled income or expenses set up in your budget for that category, and a list of transactions that make up the total shown for that category. Click a scheduled budget item to view and edit it in the main scheduled transactions list. Click a transaction to view and edit it in its account register. Any changes you make to transactions will cause the budget to be updated automatically.